
ChatGPT dots Website Access: IP Checks and API Options
Troubleshoot website access in ChatGPT dots, check its exit IP, and explore SpideyData APIs for retrieving the web content your research needs.
Why a page can work for you and fail for your dot
Ask your dot to keep an eye on a few competitors: check their product announcements, track pricing changes, and bring back anything worth investigating. It is an appealing use of an agent that can continue working between conversations. Then one of the websites refuses to load.
Instead of a pricing page, your dot gets an access-denied message, a verification screen, or an empty page. The research stops because the source material is missing. Asking it to try harder gives it no new way to reach that material. The useful next step is to inspect where the request came from, what the website returned, and which retrieval methods the task can use.
OpenAI featured dots in its September 28–October 2, 2026 product update as agents that handle ongoing work in ChatGPT, including delegating tasks to ChatGPT Work or Codex. We use the official name, ChatGPT dots, throughout this article. [1]
Your dot has a cloud computer and browser of its own. That browser has separate sessions and does not automatically inherit your desktop browser’s logins. OpenAI explicitly acknowledges that some websites block cloud browsers or require additional verification. [2]
It opens on my laptop is a useful observation, but it leaves several variables unresolved. Your laptop and the cloud browser may differ in network exit, login state, and browser environment. IP is one variable worth checking, not a diagnosis by itself.
Check the exit IP through the browser that failed
An exit IP is the public address a destination sees when a request reaches it. To inspect your dot’s browser connection, have that same cloud browser visit an IP lookup service. Record the address, the reported network owner and autonomous system number (ASN), and the time. Cross-check the result with a second service.
Keep the execution path consistent. A browser, a command-line request, a search tool, and an external plugin can use different network paths. An IP returned by a separate tool does not establish which address the cloud browser used.
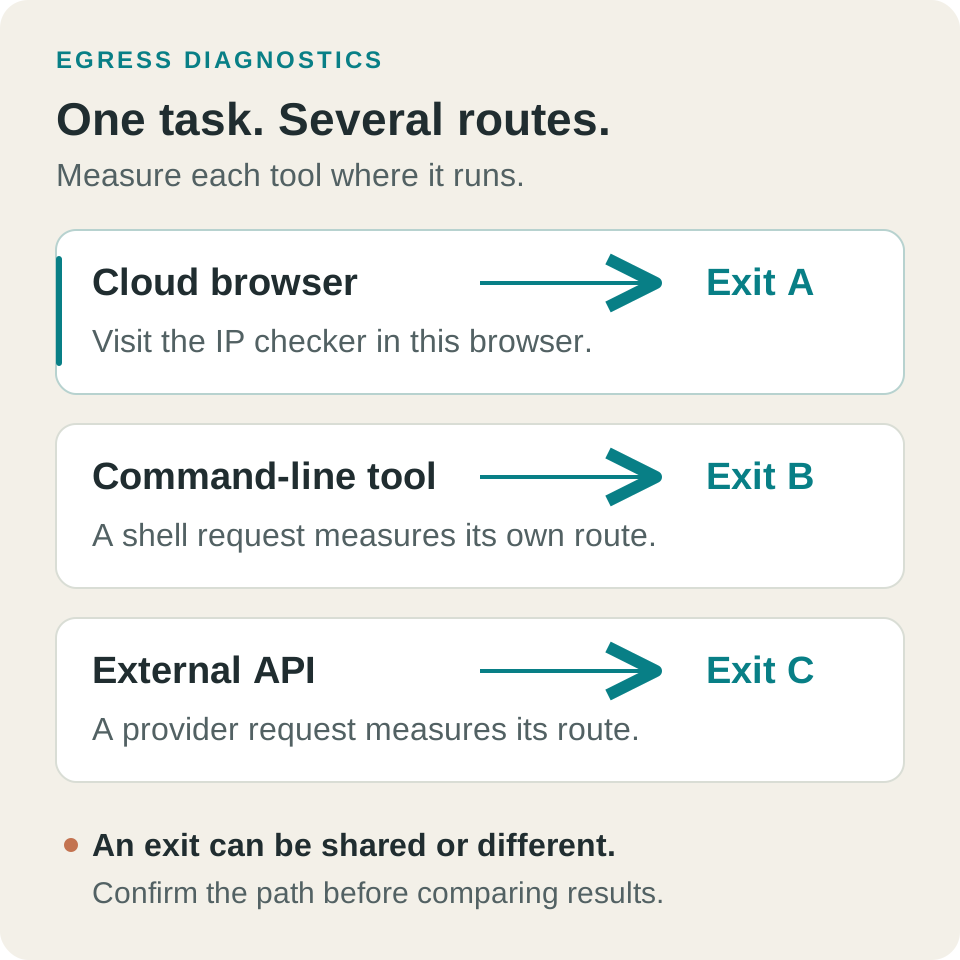
Ask the dot to state which tool it actually used. An IP checker can itself fail to load, and different lookup services may disagree on location or network type. Preserve those results instead of treating either label as ground truth.
Prompt: inspect the cloud browser’s exitUsing your own cloud browser, open https://ping0.cc
and cross-check with https://ipinfo.io.
Record the time, public IP, ASN, network owner,
region, and any network-type label shown.
State which browser or tool made each request.
Preserve a screenshot of the result or failure.
Do not switch to my local computer or change proxy
settings. If a page fails, record what happened.What a Cloudflare label actually tells you
IP-based restrictions are a plausible explanation. Cloudflare, for example, documents access rules based on visitor IP, ASN, or country. That establishes a mechanism websites can use; it does not establish why a particular request was blocked. [3]
A Cloudflare-branded challenge and a Cloudflare-attributed exit address describe different parts of a connection. We do not have a verified measurement establishing that all dots use Cloudflare for outbound traffic. Even one confirmed address would describe that observed request, not every dot, tool, or future session.
For stronger evidence, compare exits while keeping the browser, login state, target URL, and timing as consistent as possible. If you operate the target website, its security logs may identify the rule responsible.
- What it supports
- The response involves Cloudflare’s service
- What it does not establish
- Cloudflare supplies the dot’s outbound connection
- What it supports
- That service’s attribution of the observed address
- What it does not establish
- Every dot, tool, or request uses the same network
- What it supports
- The two environments produced different results
- What it does not establish
- IP was the only difference or the sole cause
Identify the failure before choosing a fix
Several problems can look like the website is blocked. A status code starts the investigation; it rarely finishes it. Cloudflare’s bot detection also considers request headers, session characteristics, and browser signals, alongside mechanisms such as JavaScript detection. Changing the IP changes only part of that environment. [4]
For an occasional blocked page, OpenAI suggests trying a connected local computer. This can create a separate local task; it does not transfer the cloud browser’s session. The computer must remain online with the app open for local steps to run. [2]
For recurring research, a dedicated data API is another option to evaluate. First identify the missing capability: authentication, rendering, a different network route, or simply a slower request schedule.
- Check first
- Cloud-browser sign-in and account access
- A useful next step
- Use the supported private sign-in or browser takeover flow
- Check first
- Site policy, network exit, session, and browser signals
- A useful next step
- Capture the failure and compare access conditions
- Check first
- Request frequency and any specified waiting period
- A useful next step
- Reduce frequency and respect retry guidance
- Check first
- JavaScript rendering and loading time
- A useful next step
- Try a retrieval method that supports rendering
- Check first
- Whether the execution environment permits the request
- A useful next step
- Have an authorized person resolve the restriction
Give the research task a SpideyData retrieval step
A competitor report needs source material: product names, prices, publication dates, page text, and links. Once those are available, your dot can compare changes and prepare its analysis. SpideyData provides APIs for that retrieval step: a task can request page content or create a managed browser session with an explicit network configuration.
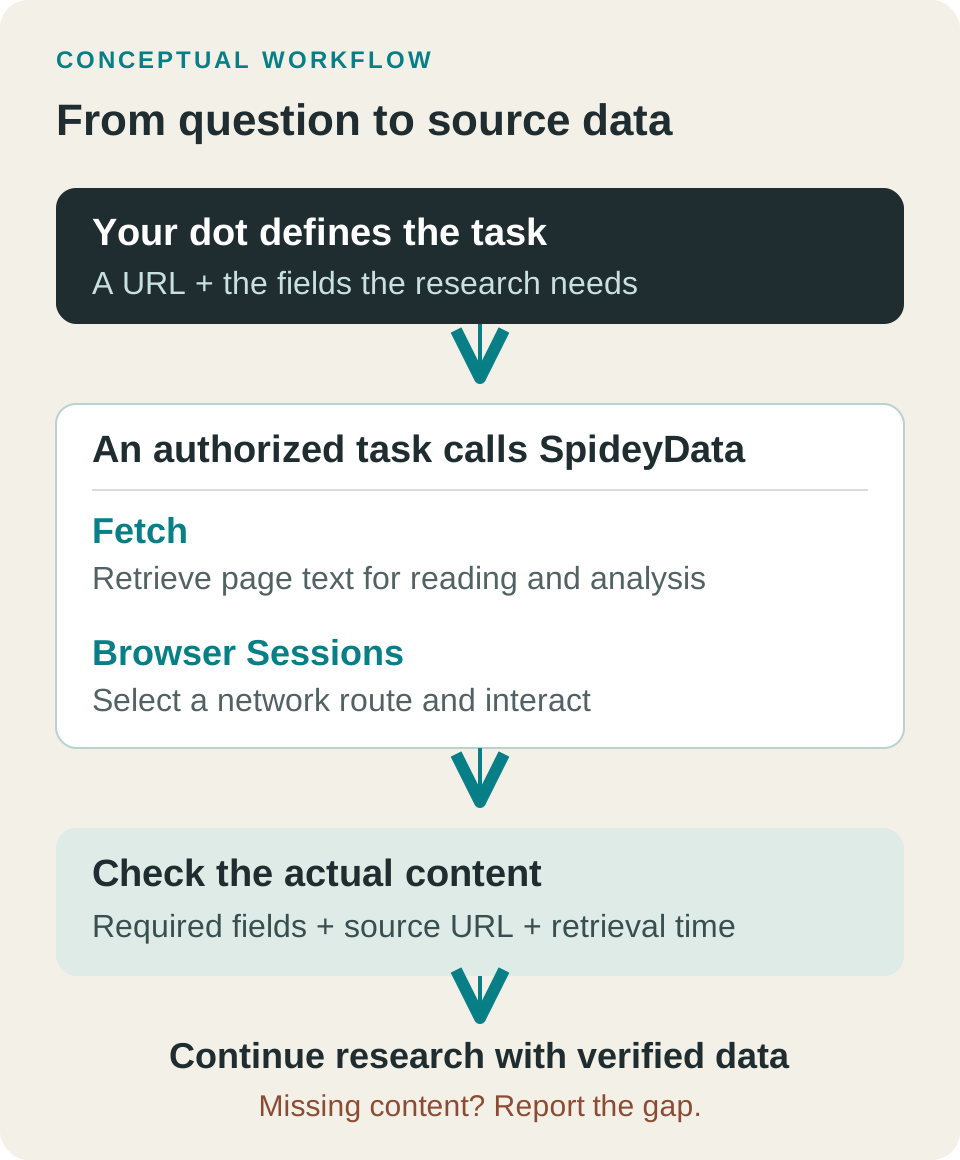
Choose the API according to what the task needs. Page text is a different requirement from operating an interactive browser with a selected network route.
Use Fetch when the task needs page content
POST /v1/fetch accepts a URL and returns a page result that includes result.content.markdown, the final URL, and execution diagnostics. This gives a reading, summarization, or comparison task a direct way to request source text. [5]
Fetch follows its own server-side network policy. A successful Fetch call does not mean the dot’s original browser has changed IP. Use the documented request fields rather than adding unsupported proxy options.
For a pricing check, inspect the returned text for the product name, displayed price, currency, and billing period. A response with a title and navigation menu alone is incomplete for that task, even if the request completed successfully.
Use Browser Sessions for network selection and interaction
The Browser API lets a client create a session and obtain a Chrome DevTools Protocol (CDP) connection for tools such as Playwright or Puppeteer. Its public network options include dynamic proxies, existing static resources, custom proxy resources, and direct connections. Available resources and regions depend on the current product configuration and the caller’s permissions. [6, 7]
The task then operates a browser managed by SpideyData. This gives it a separate retrieval environment with a selected network configuration. It does not automatically transfer the dot’s browser login, and access to the target site still needs to be tested.
Use this route when the task needs browser interaction or deliberate network selection. Record both the configured route and the observed result. A new exit IP is a diagnostic observation; the required source content is the outcome you are trying to obtain.
Start with one page and one delegated task
Create an appropriately scoped SpideyData Team API Key and configure it in the environment that will execute the request. One documented dots execution option is to delegate a Codex task to a connected computer, subject to its existing permissions. That local route depends on the computer remaining available. [2]
Give the task a specific URL and a clear definition of the fields you need. Adapt the prompt below for an initial integration test.
This describes an API integration to implement and test. A REST client, a remote-browser client, and an installable dots plugin are separate forms of integration. OpenAI supports plugins that include tools and skills, but that support does not make an arbitrary API an already available plugin. We are not presenting a native SpideyData dots plugin here. [8]
Validation scope: we checked SpideyData’s public API documentation and implementation boundaries for this article. We have not yet completed an end-to-end comparison between a specific dot’s failed request and a successful SpideyData retrieval of the same target. Evaluate this workflow against your own pages and requirements.
Prompt: evaluate one SpideyData retrievalRetrieve the URL I provide using SpideyData in the
authorized execution environment. Extract the
fields I specify.
Read https://kieapi.com/api-docs/fetch.md first.
For network selection or browser interaction,
read https://kieapi.com/api-docs/browser.md.
Read credentials from the execution environment.
Test one page before expanding the work.
Preserve its source URL and retrieval time.
Confirm the requested data is actually present.
Report login, permission, or verification needs.
Do not treat a retrieval failure as “no data.”Measure whether the research can continue
Define success in terms of the data your task needs. A pricing monitor must retrieve the current price and its billing period. An article review must retrieve the article’s body. An HTTP 200 response containing a verification page satisfies neither task.
Keep the original failure, the alternative retrieval result, the timestamps, and any remaining gaps. For ongoing monitoring, a failed fetch must remain distinguishable from the price did not change or there are no new articles.
If website access is holding up your dot’s research, start with one URL you are authorized to access. Follow the SpideyData Fetch guide for page text or the Browser guide for a managed browser session, linked below. Confirm that the result supplies the material your research needs, then add that retrieval step to the recurring workflow.
Sources checked October 5, 2026. Written by the SpideyData team; the product integration discussed here uses our own service. The cover and diagrams are original illustrations, not screenshots of a live dots session.
Sources and further reading
- [1] OpenAI: product update, September 28–October 2, 2026
- [2] OpenAI: computers and apps for dots
- [3] Cloudflare: IP Access rules
- [4] Cloudflare: bot detection engines
- [5] SpideyData: Fetch API documentation for agents
- [6] SpideyData: Browser API documentation for agents
- [7] SpideyData: Browser API schema
- [8] OpenAI: plugins
- Start here: SpideyData Fetch guide
- Configure a session: SpideyData Browser guide
- Related field note: how bot detection evaluates a whole session
Try the smallest path that fits your target
Start with the public Fetch guide, then add browser rendering, crawling, or extraction when the workflow needs it.